In this article we are going to cover How to install Prometheus on Ubuntu 22.04 LTS, Configure prometheus on Ubuntu 22.04 LTS and Access prometheus on browser.
Table of Contents
Step #1:Update System Packages on Ubuntu 22.04 LTS
You should update the latest package to ensure you are using the most recent package. To update the package run the below command.
sudo apt update
Step #2:Create a System User for Prometheus
To create a user and a group, and to add a user to the group follow the below commands.
sudo groupadd --system prometheus
sudo useradd -s /sbin/nologin --system -g prometheus prometheus
These commands are used to create a system group and user for the Prometheus monitoring tool on a Unix-like operating system. Let’s break down the commands:
- sudo groupadd –system prometheus: This command creates a system group named “prometheus.” System groups are typically used for system accounts and services. The –system option indicates that this is a system group.
- sudo useradd -s /sbin/nologin –system -g prometheus prometheus: This command creates a system user named “prometheus” associated with the “prometheus” group. Here’s what each option does:
- -s /sbin/nologin: Sets the login shell for the user to “/sbin/nologin.” This is a special shell that doesn’t allow interactive logins, commonly used for service accounts that don’t need a regular shell.
- –system: Indicates that this is a system user account.
- -g prometheus: Specifies the primary group for the user, in this case, the “prometheus” group.
Step #3:Create Directories for Prometheus
To store configuration files and libraries we need to create it on location /etc and /var/lib respectively. To store the configuration
sudo mkdir /etc/prometheus
sudo mkdir /var/lib/prometheus
sudo mkdir /etc/prometheus: This command creates a directory named “prometheus” under the “/etc” directory. The “/etc” directory is commonly used for configuration files on Unix-like systems. In the context of Prometheus, it’s likely that configuration files or settings specific to the Prometheus instance named “prometheus” will be stored in this directory.sudo mkdir /var/lib/prometheus: This command creates a directory named “prometheus” under the “/var/lib” directory. The “/var/lib” directory is typically used for variable data files, such as databases, logs, and state information. In the case of Prometheus, it’s common to store its data and related files, such as time series data and snapshots, in this directory.
Step #4:Download Prometheus and Extract Files
To download the latest update, go to the Prometheus official downloads site and copy the download link for Linux Operating System. Download using wget and the link you copied like so
wget https://github.com/prometheus/prometheus/releases/download/v2.43.0/prometheus-2.43.0.linux-amd64.tar.gz
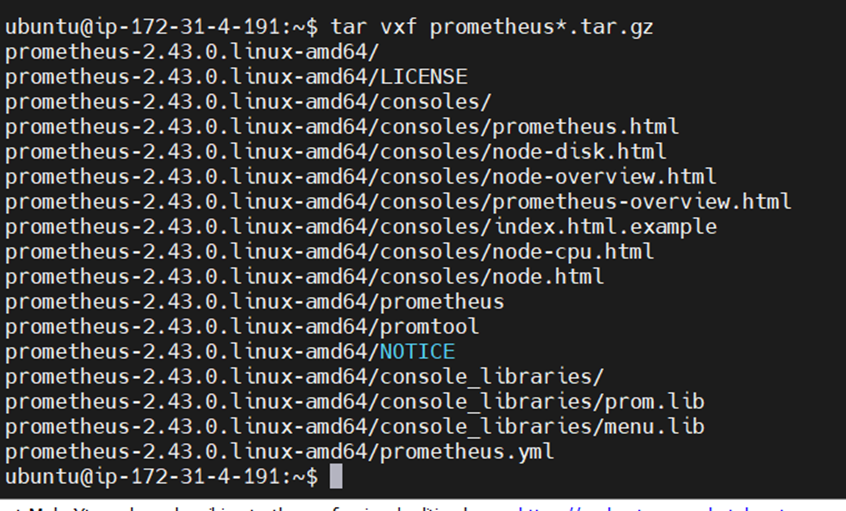
After the download has been completed, run the following command to extract the contents of the downloaded file:
tar vxf Prometheus*.tar.gzThe command tar vxf prometheus*.tar.gz is used to extract the contents of a compressed tarball file named “prometheus*.tar.gz.” Let’s break down the components of the command:
tar: This is the command-line utility used for handling tarball (Tape ARchive) files on Unix-like operating systems. It’s often used for creating, viewing, extracting, and managing tar archives.v: This option stands for “verbose.” When this option is used, tar will display the names of the files it processes, providing more detailed information about the extraction process.x: This option tells tar to extract the contents of the tarball.f: This option indicates that the next argument is the name of the tarball file to be processed.prometheus*.tar.gz: This is the argument specifying the name of the tarball file. The asterisk (*) is a wildcard character that matches any characters, so it will match a file named “prometheus” followed by any characters and ending with “.tar.gz.”

After extracting the files, navigate to the newly extracted Prometheus directory using the following command:
cd prometheus*/
The command “cd prometheus*/” is used to change the current directory in a Unix-like command-line environment. Let’s break down the command:
cd: This stands for “change directory,” and it’s a command used to change the current working directory.prometheus*/: This is a glob pattern, where the asterisk (*) is a wildcard character that matches any sequence of characters. In this context, it’s used to match any directory whose name starts with “prometheus.”
So, when you run this command, it will change the current directory to the first directory that matches the pattern “prometheus*.” This can be useful when you have multiple directories with names like “prometheus,” “prometheus2,” etc., and you want to quickly navigate to one of them without typing the full directory name.
How to configure/Install Prometheus on Ubuntu 22.04 LTS
Step #5:Move the Binary Files & Set Owner
irst, move some binary files and change the ownership in user and group forms with the below commands.
sudo mv prometheus /usr/local/bin
sudo mv promtool /usr/local/bin
sudo chown prometheus:prometheus /usr/local/bin/prometheus
sudo chown prometheus:prometheus /usr/local/bin/promtool

These commands are used to install and configure Prometheus, a popular open-source monitoring and alerting toolkit designed for reliability and scalability of applications. Here’s a breakdown of each command:
sudo mv prometheus /usr/local/bin: This command moves the Prometheus binary (prometheus) to the/usr/local/bindirectory. This directory is often included in the system’sPATH, allowing users to run theprometheuscommand from any location in the terminal.sudo mv promtool /usr/local/bin: Similar to the first command, this moves thepromtoolbinary to the/usr/local/bindirectory.promtoolis a utility that comes with Prometheus and is used for various tasks, such as testing and linting Prometheus configuration files.sudo chown prometheus:prometheus /usr/local/bin/prometheus: This command changes the ownership of theprometheusbinary to the user and groupprometheus. This is done for security reasons, ensuring that only the specified user (prometheusin this case) has the necessary permissions to execute the Prometheus binary.sudo chown prometheus:prometheus /usr/local/bin/promtool: Similar to the previous command, this changes the ownership of thepromtoolbinary to the user and groupprometheus.
These commands are typically part of the installation and configuration process for Prometheus, ensuring that the binaries are in a system-wide executable path and are owned by a specific user (prometheus), which helps in maintaining security and access control.
Step #6:Move the Prometheus Configuration Files & Set Ownership for prometheus user and group
To move the configuration file and to set the ownership of them so Prometheus can access it use the below command.
sudo mv consoles /etc/prometheus
sudo mv console_libraries /etc/prometheus
sudo mv prometheus.yml /etc/Prometheus

sudo chown prometheus:prometheus /etc/prometheus
sudo chown -R prometheus:prometheus /etc/prometheus/consoles
sudo chown -R prometheus:prometheus /etc/prometheus/console_libraries
sudo chown -R prometheus:prometheus /var/lib/prometheus

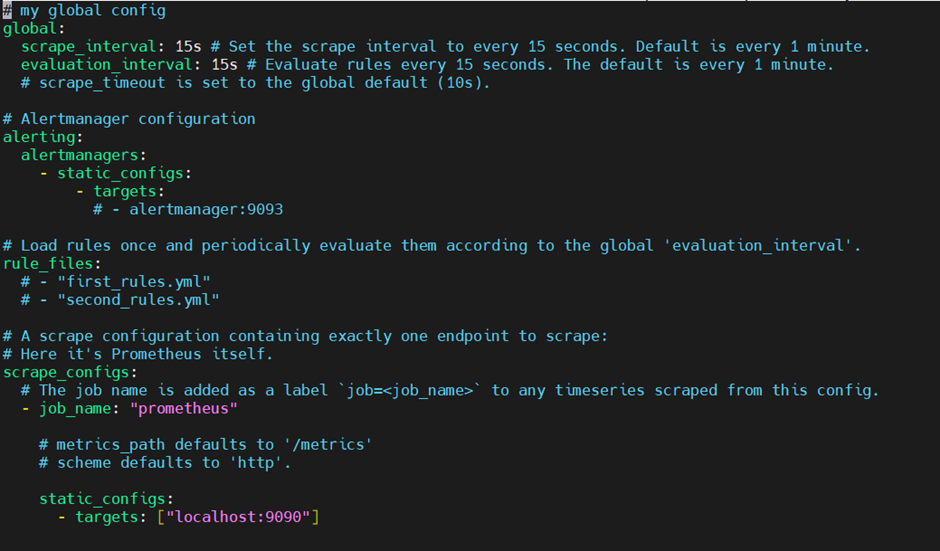
The prometheus.yml file is the main Prometheus configuration file. It includes settings for targets to be monitored, data scraping frequency, data processing, and storage. You can set alerting rules and notification conditions in the file. You don’t need to modify this file for this demonstration but feel free to open it in an editor to take a closer look at its contents.
sudo nano /etc/prometheus/prometheus.yml
The command sudo nano /etc/prometheus/prometheus.yml is used to open and edit the Prometheus configuration file (prometheus.yml) using the nano text editor. This allows users to modify the configuration settings, such as defining scrape targets, alerting rules, and other parameters that govern Prometheus’s behavior. The use of sudo grants the necessary administrative privileges to edit a system configuration file located in the /etc/prometheus directory.
Step #7:Create Prometheus Systemd Service
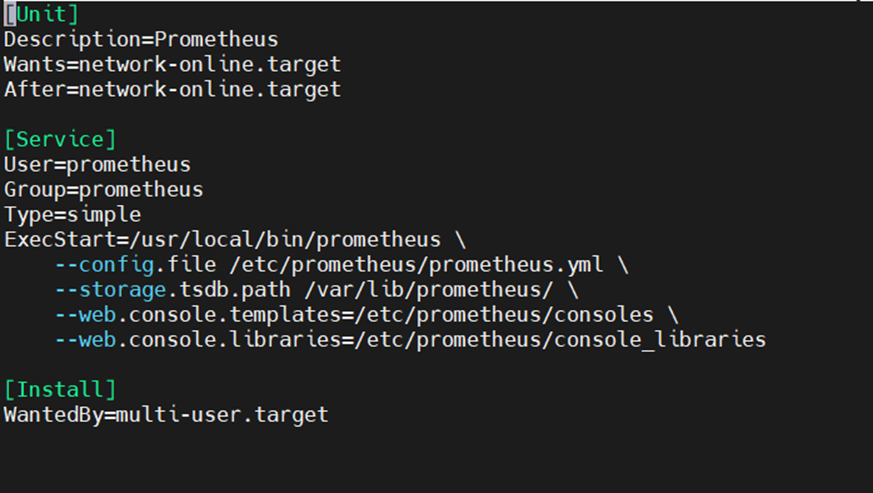
Now, you need to create a system service file for Prometheus. Create and open a Prometheus.service file with the Nano text editor using:
sudo nano /etc/systemd/system/prometheus.serviceThe command sudo nano /etc/systemd/system/prometheus.service is used to open and edit the systemd service file for Prometheus. This file typically contains configuration details for how Prometheus should be managed and started as a service by the systemd init system.
By using sudo nano, the user gains administrative privileges necessary to modify system-level configuration files. Editing the prometheus.service file allows you to customize settings such as the executable path, command-line options, user and group settings, and other parameters related to the Prometheus service.
Once the changes are made and saved, they can be applied by restarting the Prometheus service using commands like sudo systemctl daemon-reload and sudo systemctl restart prometheus.service. This ensures that the modified configuration takes effect.
Include these settings to the file, save, and exit:
[Unit]
Description=Prometheus
Wants=network-online.target
After=network-online.target

[Service]
User=prometheus
Group=prometheus
Type=simple
ExecStart=/usr/local/bin/prometheus \
    --config.file /etc/prometheus/prometheus.yml \
    --storage.tsdb.path /var/lib/prometheus/ \
    --web.console.templates=/etc/prometheus/consoles \
    --web.console.libraries=/etc/prometheus/console_libraries

[Install]
WantedBy=multi-user.target

This configuration file, usually named prometheus.service, is used to define a systemd service for Prometheus. Here’s a short explanation of each section:
[Unit]: Provides metadata and dependencies for the service.Description: Describes the service as Prometheus.WantsandAfter: Specify that the service requires the network to be online before starting.
[Service]: Configures the behavior of the Prometheus service.UserandGroup: Sets the user and group to run the service as (prometheus:prometheus in this case).Type: Specifies the service type as simple.ExecStart: Defines the command to start Prometheus with specific configuration options.
[Install]: Specifies installation-related information.WantedBy: Specifies the target that this service should be part of (multi-user.target).
Step #8:Reload Systemd service
You need to reload the system configuration files after saving the prometheus.service file so that changes made are recognized by the system. Reload the system configuration files using the following:
sudo systemctl daemon-reload
The command sudo systemctl daemon-reload is used to reload the systemd manager configuration. It’s necessary after making changes to systemd unit files to ensure that systemd recognizes and applies the modifications without requiring a system restart.
Step #9:Start and Enable Prometheus Service
Next, you want to enable and start your Prometheus service. Use the following commands:
sudo systemctl enable prometheus
sudo systemctl start prometheus

Step #10:Check Prometheus service Status
After starting the Prometheus service, you may confirm that it is running or if you have encountered errors using:
sudo systemctl status prometheus
The command sudo systemctl status prometheus is used to check the current status and information about the Prometheus service managed by systemd. It provides a brief overview of whether the service is running, its process ID, and recent log messages. This is helpful for troubleshooting, monitoring, and ensuring the proper functioning of the Prometheus service.
Step #11:Access Prometheus on a web browser
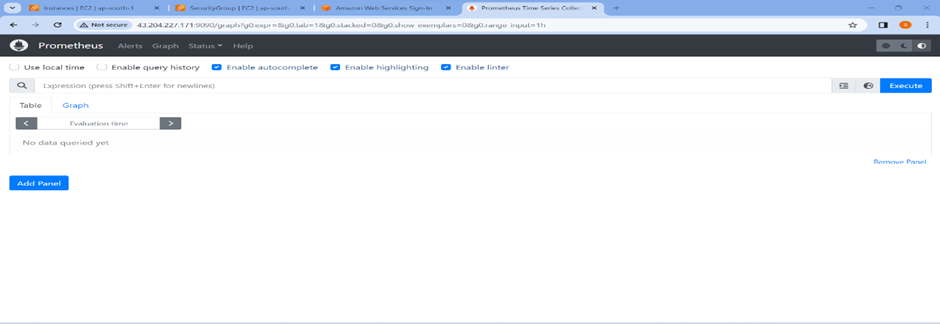
Prometheus runs on port 9090 by default so you need to allow port 9090 on your firewall, Do that using the command:
sudo ufw allow 9090/tcp
The command sudo ufw allow 9090/tcp is used to allow incoming TCP traffic on port 9090 using the Uncomplicated Firewall (UFW) on a Linux system. In short, it opens up port 9090 to enable access to services or applications that might be running on that port, such as Prometheus in many cases.
If you are using Cloud VM then allow inbound port in security group/firewall.
localhost:9090 or <ip_address>:9090
Conclusion:
In this article we have covered How to install Prometheus on Ubuntu 22.04 LTS, Configure prometheus on Ubuntu 22.04 LTS and Access prometheus on browser.
Related Articles: