In this article we are going to cover How to Install Grafana on Ubuntu 22.04 LTS, access grafana on web browser and Uninstall Grafana on Ubuntu or Debian OS.
Table of Contents
Step #1:Update system packages on Ubuntu 22.04 LTS
We need to run the system update command on the Linux system from time to time, especially before installing some software package. It is because it not only installs the latest updates available for the installed applications but even refreshes the package index cache of APT.
So, open your Ubuntu command terminal and run below commands
sudo apt update && sudo apt upgrade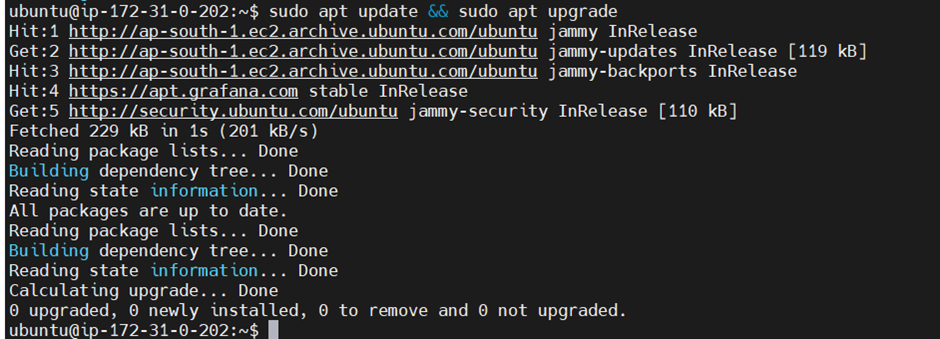
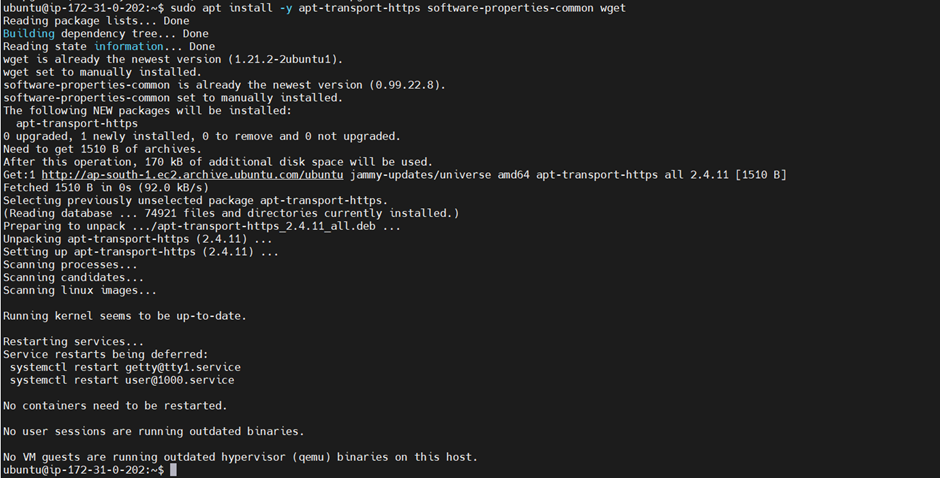
Step #2:Install Prerequisite Packages for Grafana
To install Grafana on Ubuntu 22.04 LTS there are some Prerequisite Packages like apt-transport-https, software-properties-common and wget, install them using below command
sudo apt install -y apt-transport-https software-properties-common wget
Step #3:Add Grafana GPG Key and Repository in Ubuntu 22.04 LTS
To install Grafana on Ubuntu, you can use the APT package manager. However, before that, we need to add its repository and a GPG key used to sign the packages available through that repository. it is because the default Ubuntu repos don’t supply the packages we are required to install Grafana on Linux.
sudo mkdir -p /etc/apt/keyrings/

Here’s a breakdown of the command:
sudo: It is used to run the following command with superuser privileges.
mkdir -p /etc/apt/keyrings/: This command creates the specified directory. The -p option ensures that the command creates parent directories as needed. If /etc/apt/keyrings/ already exists, it won’t produce an error.
wget -q -O - https://apt.grafana.com/gpg.key | gpg --dearmor | sudo tee /etc/apt/keyrings/grafana.gpg > /dev/nullTo add a repository for stable releases, run the following command:
echo "deb [signed-by=/etc/apt/keyrings/grafana.gpg] https://apt.grafana.com stable main" | sudo tee -a /etc/apt/sources.list.d/grafana.list
To add a repository for beta releases, run the following command:
echo "deb [signed-by=/etc/apt/keyrings/grafana.gpg] https://apt.grafana.com beta main" | sudo tee -a /etc/apt/sources.list.d/grafana.list
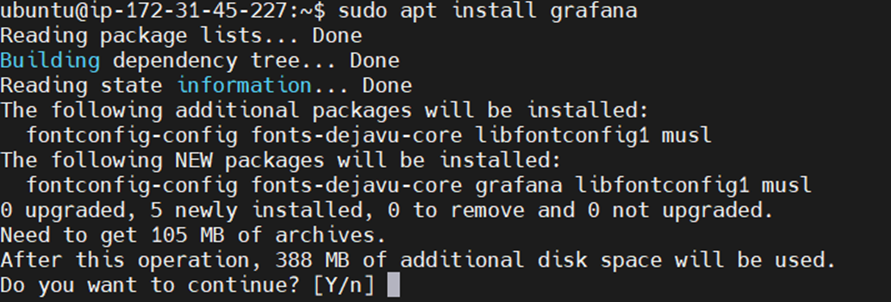
Step #4:Install Grafana on Ubuntu 22.04 LTS
Once you have executed all the above-given commands your Ubuntu system will be ready to install Grafana, however, before that rerun the system update command. It is because we have manually added a new repository in the previous step and need to refresh the APT package index cache to make it recognize the newly available packages to install.
sudo apt update
Now, use APT to install the latest Grafana open source or community edition:
sudo apt install Grafana
(optional) Those, who are interested in the latest Enterprise edition (paid), can run this command instead of the above one:
sudo apt install grafana-enterprise

Step #5:Start Grafana service and Enable at Boot
The installation process will automatically create a service file for Grafana on our Ubuntu system that we can use to start or stop it. Whereas, those who want the Grafana to start automatically with the system boot can also mark its service enabled.

sudo systemctl enable grafana-server

To check the service status, we can use:
sudo systemctl status grafana-server --no-pager -l

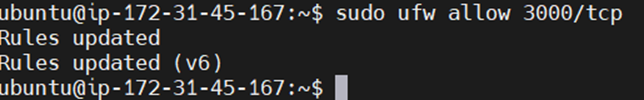
Step #6:Allow Grafana port in the Firewall
We can access the Grafana Dashboard on the local machine using its browser without any problem, however, if you are using a CLI server then definitely we need to use some other computer’s browser. Thus, to remotely access the monitoring web-based dashboard, we have to whitelist port number 3000 in our firewall.
sudo ufw allow 3000/tcp
Whereas, if you are using some cloud service such as AWS, Azure or Google Cloud then open the inbound port Security group/firewall.
If the 3000 port is already used with another service on your system then you will get an Empty reply from the Grafana server. In such cases use some custom port.
Note: To use a custom port edit the Grafana config file- sudo nano /usr/share/grafana/conf/defaults.ini and there, change the http_port = 3000 value.
After performing the change in port restart your server-
sudo systemctl restart grafana-serverStep #7:Access the Grafana on Web Interface
Grafana typically runs on port 3000. Open your web browser and navigate to http://localhost:3000 or http://your_server_ip:3000
Example:
http://your_server_ip:3000The default Grafana web interface login credentials are as follows:
Username: admin
Password: admin
You’ll be prompted to change the password after the first login.

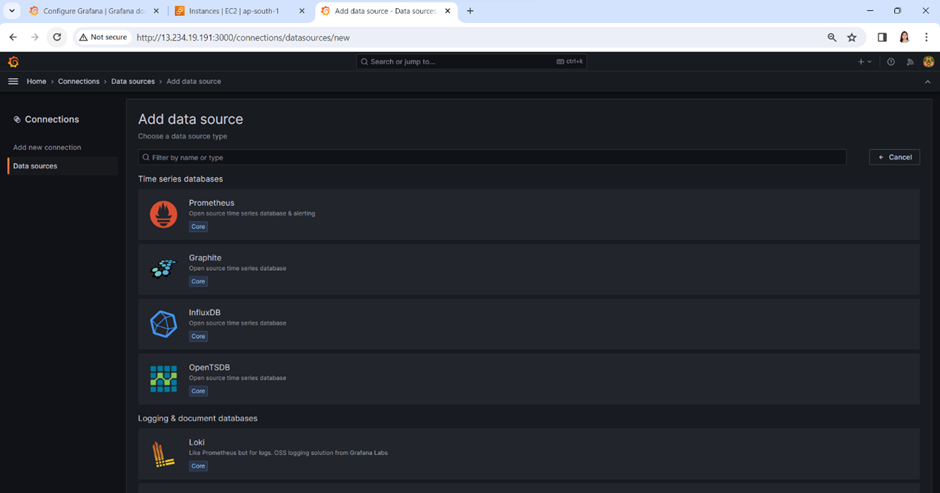
Step #8:Configure Data Sources and Create Dashboards:
Once you’ve logged in, you can start configuring data sources and creating dashboards in Grafana. This allows you to visualize data from various sources and set up monitoring and alerts as needed.

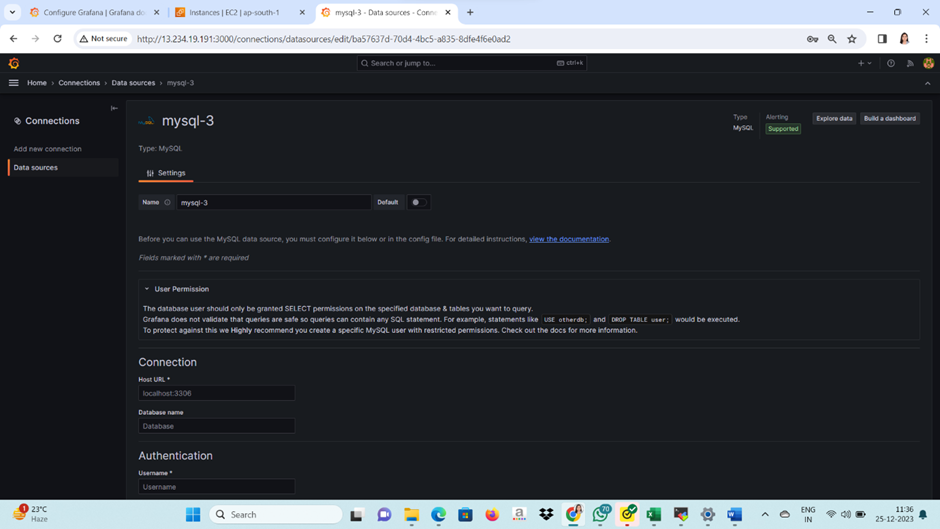
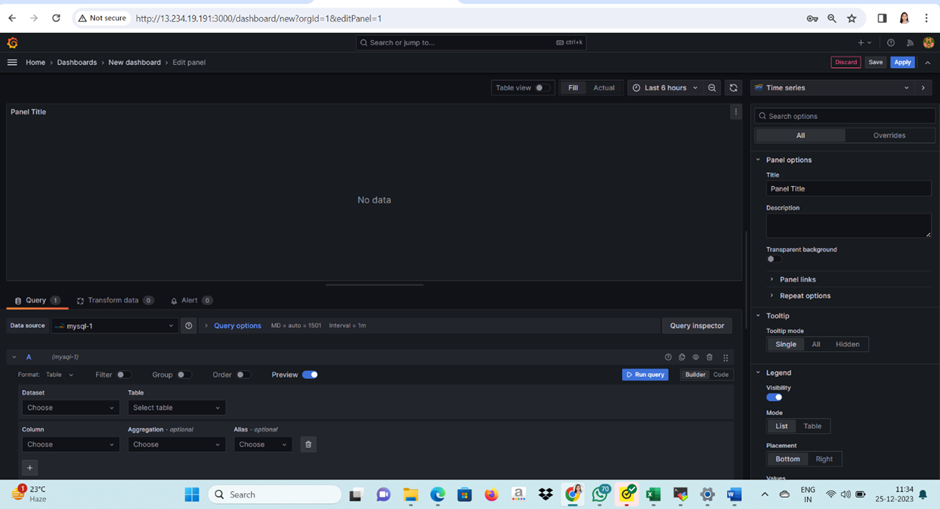
Go to Data Sources and select the source of your data. For example, here we have selected MySQL.
As we have selected the MySQL Database for the Data source, we create a Dashboard on Grafana where we use MYSQL as a source to display visualization and other information. After that, you can further configure it to what tables of the database you want to monitor.
Uninstall Grafana on Ubuntu or Debian OS
To uninstall Grafana, run the following commands in a terminal window:
If you configured Grafana to run with systemd, stop the systemd servivce for Grafana server:
sudo systemctl stop grafana-serverIf you configured Grafana to run with init.d, stop the init.d service for Grafana server:
sudo service grafana-server stopTo uninstall Grafana OSS:
sudo apt-get remove grafanaTo uninstall Grafana Enterprise:
sudo apt-get remove grafana-enterpriseOptional: To remove the Grafana repository:
sudo rm -i /etc/apt/sources.list.d/grafana.listConclusion:
In this article we have covered How to Install Grafana on Ubuntu 22.04 LTS, access grafana on web browser and Uninstall Grafana on Ubuntu or Debian OS.
Related Articles:
How to Install Prometheus on Ubuntu 22.04 LTS
Reference: