In this article we are going to cover How to Monitor Docker Containers with Prometheus and Grafana |monitoring docker containers with prometheus and grafana
Table of Contents
Prerequisites
To follow this tutorial, you will need:
- AWS Ubuntu 22.04 LTS Instance.
- User with sudo access (see the Initial Server Setup with Ubuntu 22.04 tutorial for details).
- Install Docker on Ubuntu Server with required Permission
How to Monitor Docker Containers with Prometheus and Grafana
Step #1:Create EC2, Install, start and enable Docker service through AWS EC2 User data
Launch an EC2 instance. Follow the usual steps for launching an EC2 instance through the AWS Management Console.
Navigate to the “Advanced Details” section. This section is typically located towards the bottom of the launch wizard
Paste your user data script or cloud-init directives in the “User data” field, as shown below

paste the below code
#!/bin/bash

# Update the system packages
sudo apt-get update
sudo apt-get upgrade -y

# Install Docker dependencies
sudo apt-get install -y apt-transport-https ca-certificates curl software-properties-common

# Add Docker's official GPG key in Ubuntu
curl -fsSL https://download.docker.com/linux/ubuntu/gpg | sudo gpg --dearmor -o /usr/share/keyrings/docker-archive-keyring.gpg

# Add Docker repository in Ubuntu
echo "deb [arch=amd64 signed-by=/usr/share/keyrings/docker-archive-keyring.gpg] https://download.docker.com/linux/ubuntu $(lsb_release -cs) stable" | sudo tee /etc/apt/sources.list.d/docker.list > /dev/null

# Update package information and install Docker on Ubuntu
sudo apt-get update
sudo apt-get install -y docker-ce docker-ce-cli containerd.io

# Start Docker service
sudo systemctl start docker

# Enable Docker to start on system boot
sudo systemctl enable docker

#Adjust Docker Permissions:
sudo chmod 666 /var/run/docker.sock
once EC2 Instance is ready check docker service
sudo systemctl status dockerOutput:
 docker.service - Docker Application Container Engine
     Loaded: loaded (/lib/systemd/system/docker.service; enabled; vendor preset: enabled)
     Active: active (running) since Fri 2024-03-01 14:13:23 UTC; 4min 21s ago
TriggeredBy: ● docker.socket
       Docs: https://docs.docker.com
   Main PID: 7699 (dockerd)
      Tasks: 8
     Memory: 27.1M
        CPU: 330ms
     CGroup: /system.slice/docker.service
             └─7699 /usr/bin/dockerd -H fd:// --containerd=/run/containerd/containerd.sock
Step #2:Create Nginx Docker Containers
Create index.html for Nginx docker Image
sudo nano index.html
paste the below code
<!doctype html>
<html>
 <body style="backgroud-color:rgb(49, 214, 220);"><center>
    <head>
     <title>Docker Project</title>
    </head>
    <body>
     <p>Welcome to my Docker Project!<p>
        <p>Today's Date and Time is: <span id='date-time'></span><p>
        <script>
             var dateAndTime = new Date();
             document.getElementById('date-time').innerHTML=dateAndTime.toLocaleString();
        </script>
        </body>
</html>
Save and exit the index.html file
Create Dockerfile file Nginx
sudo nano DockerfileFROM nginx:1.10.1-alpine
COPY index.html /usr/share/nginx/html
EXPOSE 8080
CMD ["nginx", "-g", "daemon off;"]Save and exit the Dockerfile file
Build the Docker image using the following command:
docker build -t nginx .Run the Docker container using the following command
docker run -d -p 8080:80 nginxcheck the Nginx Docker container running status
docker psOutput:

http://65.2.187.33:8080/Output:

Step #3:Run Prometheus using Docker Container
Create prometheus.yaml file
sudo nano prometheus.yamlpaste the below configs
global:
  scrape_interval: 15s # By default, scrape targets every 15 seconds.

  # Attach these labels to any time series or alerts when communicating with
  # external systems (federation, remote storage, Alertmanager).
  external_labels:
    monitor: 'Docker-monitor'

# A scrape configuration containing exactly one endpoint to scrape:
# Here it's Prometheus itself.
scrape_configs:
  # The job name is added as a label `job=<job_name>` to any timeseries scraped from this config.
  - job_name: 'prometheus'

    # Override global default and scrape targets from this job every 5 seconds.
    scrape_interval: 5s

    static_configs:
      - targets: ['SERVER_IP:9090']
save this file and exit.
Run Prometheus Docker Container
sudo docker run -d --name prometheus -v $(pwd):/etc/config -p 9090:9090 prom/prometheus --config.file=/etc/config/prometheus.yamlCheck prometheus docker container running status
docker psOutput:

if prometheus docker not running, then run below command to start prometheus docker container
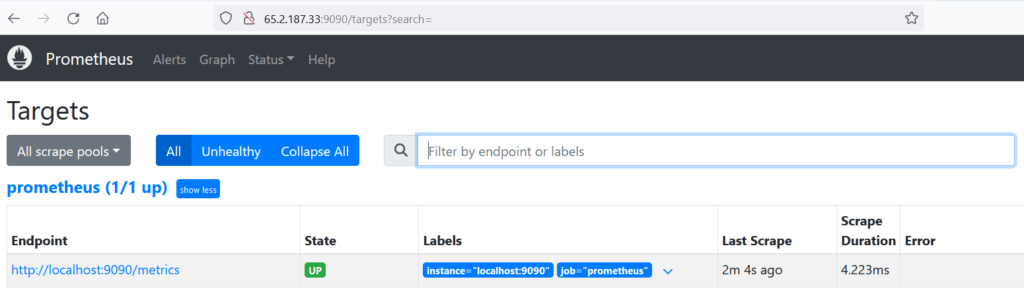
docker run -p 9090:9090 -d prom/prometheus Access Prometheus Page through Browser
Step #3:Integrate Docker Container with Grafana
Locate the configuration file of the Docker daemon, daemon.json. The file is usually found in the /etc/docker/ directory.
If the daemon.json file is not present in the specified location, create a new file named daemon.json.
Open the daemon.json file using a text editor.
sudo nano /etc/docker/daemon.json
Add the following code snippet to the daemon.json file:
{
        "metrics-addr" : "0.0.0.0:9323",
        "experimental" : true
}
save and exit the file.
For apply this change you have to restart docker service
sudo systemctl restart dockerStart prometheus and nginx docker containers again
docker run -p 9090:9090 -d prom/prometheus docker run -d -p 8080:80 nginxNow wait some time and then check logs on
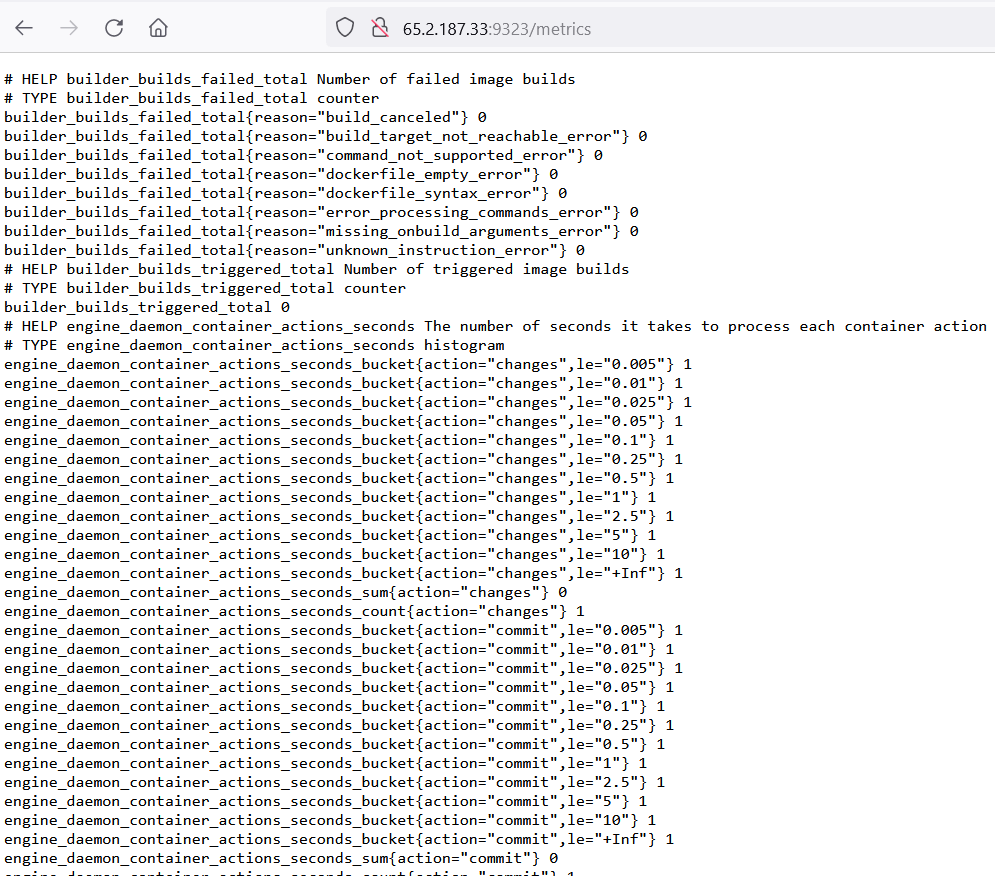
http://<public-ip>:9323/metrics
You should get docker logs on webpage like following.
Step #4:Add New Docker Job Targets in Prometheus
list all docker containers
docker ps
Output:

Edit the prometheus.yml located in prom/prometheus container
docker exec -it 35f48c303e80 /bin/shGo to Prometheus config file location in Prometheus container
cd /etc/prometheus
vi prometheus.yml
Add Docker job in prometheus.yaml file
- job_name: 'docker'
  scrape_interval: 5s
  static_configs:
    - targets: ['65.2.187.33:9323']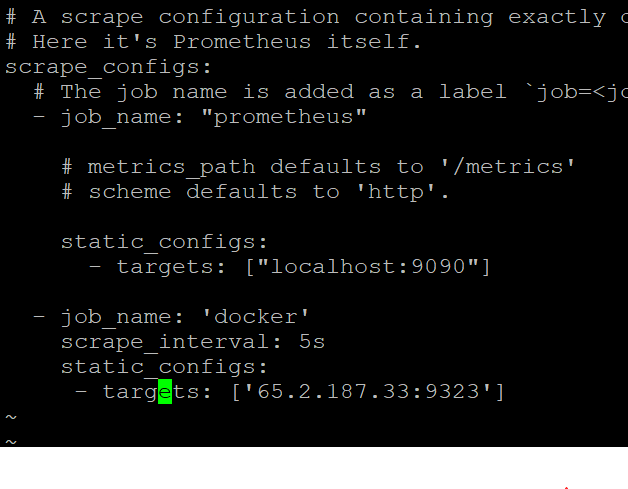
Exit after saving
exit
After above step you have to restart Prometheus docker container
docker restart <container id>
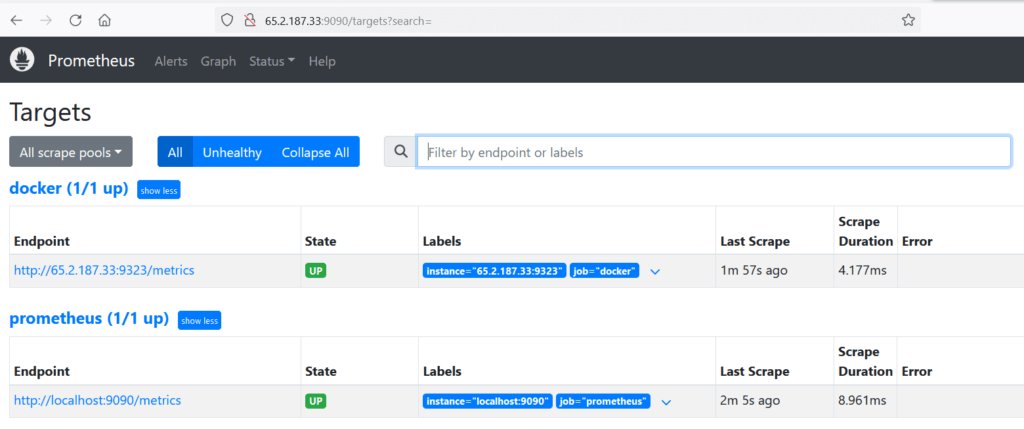
The Target of docker will added in prometheus targets section.
Step #5:Install and Run Grafana using Docker
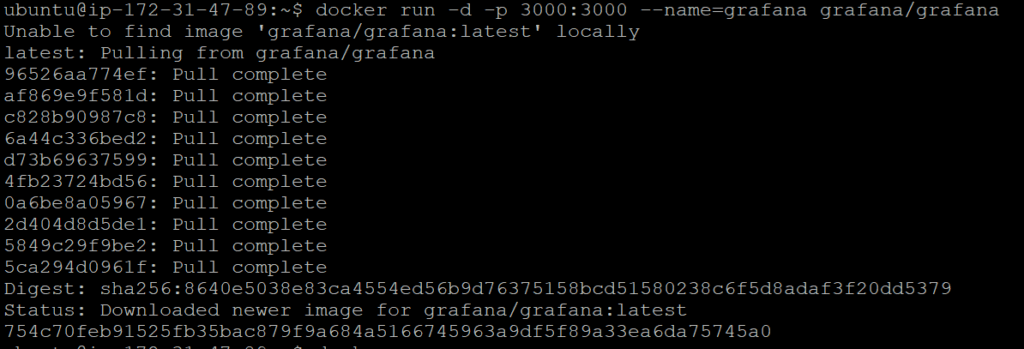
- To run the latest stable version of Grafana, run the following command
docker run -d -p 3000:3000 --name=grafana grafana/grafanaOutput:
Check Grafana Container running status
docker psOutput:

login to Grafana using Grafana default username and password: admin

Step #6:Add Prometheus Data Source in Grafana
Access the Configuration menu: Click on the gear icon (cogwheel) in the Grafana sidebar to open the Configuration menu.
Open the Data Sources section: Navigate to the Data Sources section by clicking on it within the Configuration menu.
Add a new data source: Click on the Add data source button.
Select Prometheus data source type: From the list of available data source types, choose Prometheus.
Configure the data source settings:
URL: Enter the URL of your Prometheus server. The default URL is typically http://localhost:9090/.
Access: You can choose the access method for your Prometheus server. The options may include “Direct” or “Proxy” depending on your setup. Refer to the Grafana documentation for detailed information on access methods.
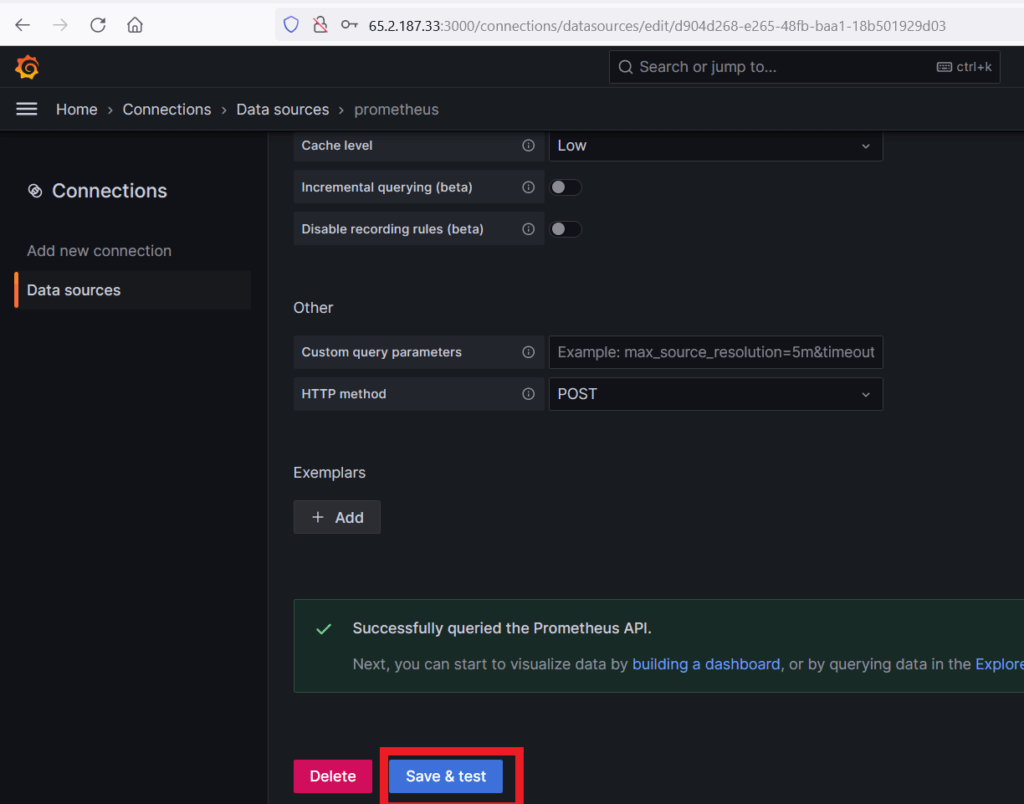
Save and test the data source: Click the Save & Test button to save the newly configured Prometheus data source and test the connection.
Once the test is successful, you can use the Prometheus data source to create dashboards and visualize metrics in Grafana.

save and test.
Step #7:Monitor Docker Containers with Grafana
Below are example Prometheus Docker Metrics
- engine_daemmon_engine_cpus_cpus – Shows number of Engine CPU metrics
- engine_daemon_container_states_containers{state=”stopped”} – Shows stopped containers
- engine_daemon_container_states_containers{state=”paused”} – Shows paused containers
- engine_daemon_container_states_containers{state=”running”} – Shows running containers
Click on Dashboards and then click on Create Dashboard -> Add Visualization -> select Prometheus Data Source
In the Metrics browser selection select engine_daemmon_engine_cpus_cpus then select job and job name is docker. Then click Run queries will fetch the number of Engine CPU.

To create Grafana Dashboard for number of containers running, follow above steps and add below prometheis metrics as shown below
engine_daemon_container_states_containers{state=”running”} – Shows running containers

Conclusion:
We have covered How to Monitor Docker Containers with Prometheus and Grafana |monitoring docker containers with prometheus and grafana.
Related Articles:
How to Install Prometheus on Ubuntu 22.04 LTS
Secure Grafana with Nginx, Reverse Proxy and Certbot
Reference: