In this article, We are going to cover Best Open Source Kubernetes Monitoring Tools
Having more than 50,000 stars on GitHub Platform with over 2,200 contributors across the globe, Kubernetes is primarily the de facto standard for accelerating container orchestration. Before getting into solving the major challenges involved in running distributed micro services, it also has come out with the new ones.
Not surprisingly, when asked, the most challenging and obstacle was going for adopting Kubernetes. After all, analyzing as well as monitoring distributed environments have never been easy, and Kubernetes has added additional complexity to it. What is not surprising is the development of several open-source monitoring tools for Kubernetes to help to overcome the challenge.
These tools were formed for tackling several aspects of the above-mentioned challenge. Some might help with logs and others with metrics. Few of them are data collectors, while others provide a hassle-free interface for operating Kubernetes from a bird’s eye perspective.
Some of them are Kubernetes agnostic, and others are Kubernetes native. This depth, along with various work as an entire ecosystem and a community. Let us look at some of the important open source monitoring tools for Kubernetes.
Table of Contents
Open Source Kubernetes Monitoring Tools
1. Prometheus
If we tend to explore the open-source monitoring tools, then there are several in the market presently like InfluxDB, Cassandra, Graphite, etc., but none are as Kubernetes users as Prometheus is. Initially, it was a Sound Cloud project and presently part of the CNCF(Cloud Native Computing Foundation).
You can use the Prometheus to monitor your servers, databases, etc. to analyze the applications and infrastructure’s performance. It can easily access the data from the app’s client libraries.
Another biggest advantage is that Prometheus is a flexible multi-dimensional data model. Kubernetes and Prometheus use the “Labels.” It helps to identify the time series and can use in the query language (PromQL).
Prometheus has become the defacto open-source monitoring Kubernetes. In a nutshell, what makes Prometheus competitive among its contemporaries is its multi-dimensional data model, PromQL( the Prometheus querying language) with a built-in alerting mechanism, a push or pull model and yes not to forget the ever-growing community. These reasons make Prometheus a prominent solution for the Kubernetes users, and the two important projects are now closely integrated users can run it on top of Kubernetes using the Prometheus Operator.
2. Grafana
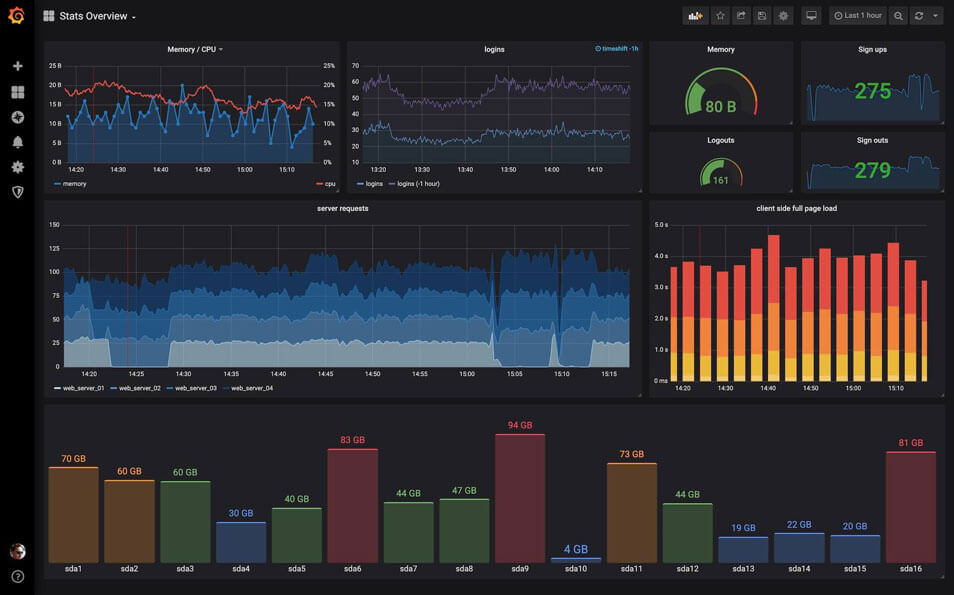
Grafana is an open-source Kubernetes monitoring tool for analytics and visualization. What Grafana actually does is that it pulls up the metrics from different data resources like MySQL, MSSQL, Prometheus, Elastic Search, etc. Its dashboard is centralized, placed on analyzing and data visualization on the real-time metrics.
There are two types of metrics for the Kubernetes monitoring i.e., system-level metrics and application-level metrics.
For slicing Kubernetes metrics and also for constructing an analytical dashboard, Grafana is second to none. While attempting to analyze Kubernetes, Grafana needs to usually sit and monitor Prometheus, although Grafana, together with graphite or Influx Db is also common setups. There seem several reasons Grafana is so popular, its ability to get infused with a long list of data sources being one of them.
Grafana is a widely used robust form with a feature of a long list of capabilities such as annotations, dashboard authentication/authorization, cross-organizational collaboration, and much more. It comes with a super easy interface with Kubernetes setup then seems to have several deployment specifications that include a Grafana container by default with several of Kubernetes monitoring dashboards for Grafana available for use.
3. Elastic Stack
For logging into the Kubernetes, one of the most recognized open source monitoring tools is the ELK Stack. An acronym for Elasticsearch, Logstash, and Kibana, includes a fourth component known as Beats, which are lightweight data shippers. Each component within the stack takes care of a different while following the logging pipeline, and together, they all provide a powerful and exhaustive logging option for Kubernetes.
Logstash is capable of aggregating and processing logs before sending them on for storage. Elasticsearch was designed to be scalable and perform well, even when storing and searching across millions of documents. Kibana does a great job of providing users with the analysis interface needed to make sense of the data.
All the different components of the stack can be deployed easily into a Kubernetes environment. You can run the components as pods using various deployment configurations. Besides that you can use helm charts. Both Filebeat and MetricBeat are deployed as daemon sets and will append Kubernetes metadata to the documents.
4. cAdvisor (Container Advisor)
cAdvisor (Container Advisor) is an open-source agent specially curated for processing, collecting, and exporting resource usage and performance information about running containers. To make it compatible with Kubernetes, it is integrated into the Kubelet binary.
The tool focuses on container level performance and already embedded into Kubernetes. Hence, it can automatically discover active containers. Additionally, it can also monitor the events. One thing that should be taken into consideration that cAdvisors don’t store metrics for long term use.
Like the InfluxDB, cAdvisor is also deployed on the node level, not on per pod. It will auto-discover all the containers running on a machine and collect system metrics such as memory, CPU, network, etc. to provide quick insight. cAdvisor is one of the more basic open source, Kubernetes-native monitoring tools.
5. InfluxDB
InfluxData, the company behind InfluxDB, provides a platform known as the TICK stack. This is a comprehensive platform to collect, store, analyze, and visualize time series data. The TICK stack comprises Telegraf, InfluxDB, Chronograph, and Kapacitor. Here, we will concentrate on the core product, InfluxDB, which is used to store and query the time series database.
The best thing about the InfluxDB is that it can monitor private and public infrastructure, and you can get the broad insight. InfluxDB helps to identify the problems before letting them affect critical processes and resolve them in real-time.
Most importantly, it offers various ways to implement Kubernetes monitoring without overloading IT operations. InfluxDB’s purpose-built design for time series, both numeric and non-numeric, allows for very high volume storage of monitoring records along with the horizontal scalability and high availability with clustering.
6. Heapster
Heapster is another uniform platform to send the monitoring metrics to a system. To collect the metrics, it works between clusters and storage. Heapster is compatible with Kubernetes versions 1.0.6 and above to cluster monitoring and analysis of the performance for Kubernetes.
It collects various signals like compute resource usage, lifecycle events, and then interpret them. The best thing about Heapster is that it can support multiple sources of data. All you need to do is install Heapster as a pod inside the Kubernetes; it will gather the data from the pods and containers within the cluster.
Overall, the great thing about Heapster is that it is a fully open-source as part of the Kubernetes project. It supports a multitude of backends for persisting the data, including Influxdb, Elasticsearch, and Graphite.
Conclusion
Our list has mentioned the top 5 Open sources Kubernetes monitoring tools towards the betterment of the Kubernetes. Monitoring tools should be durable to provide you the required insights so that you can analyze the performance in real-time. These tools are easy to deploy and test.
So, if you are looking for the Kubernetes monitoring tools, then pick these.
Related Articles
Reference